Debugging Front-end Issues: Tools and Techniques
Debugging skills are essential for front-end developers as we create products for various browsers, using different languages, and especially with different screen sizes. Therefore, as front-end engineers, we must continuously develop and improve our debugging skills.
There are several tools and techniques that can be used to debug front-end issues. ome of the most common include:
Browser Developer Tools
Element
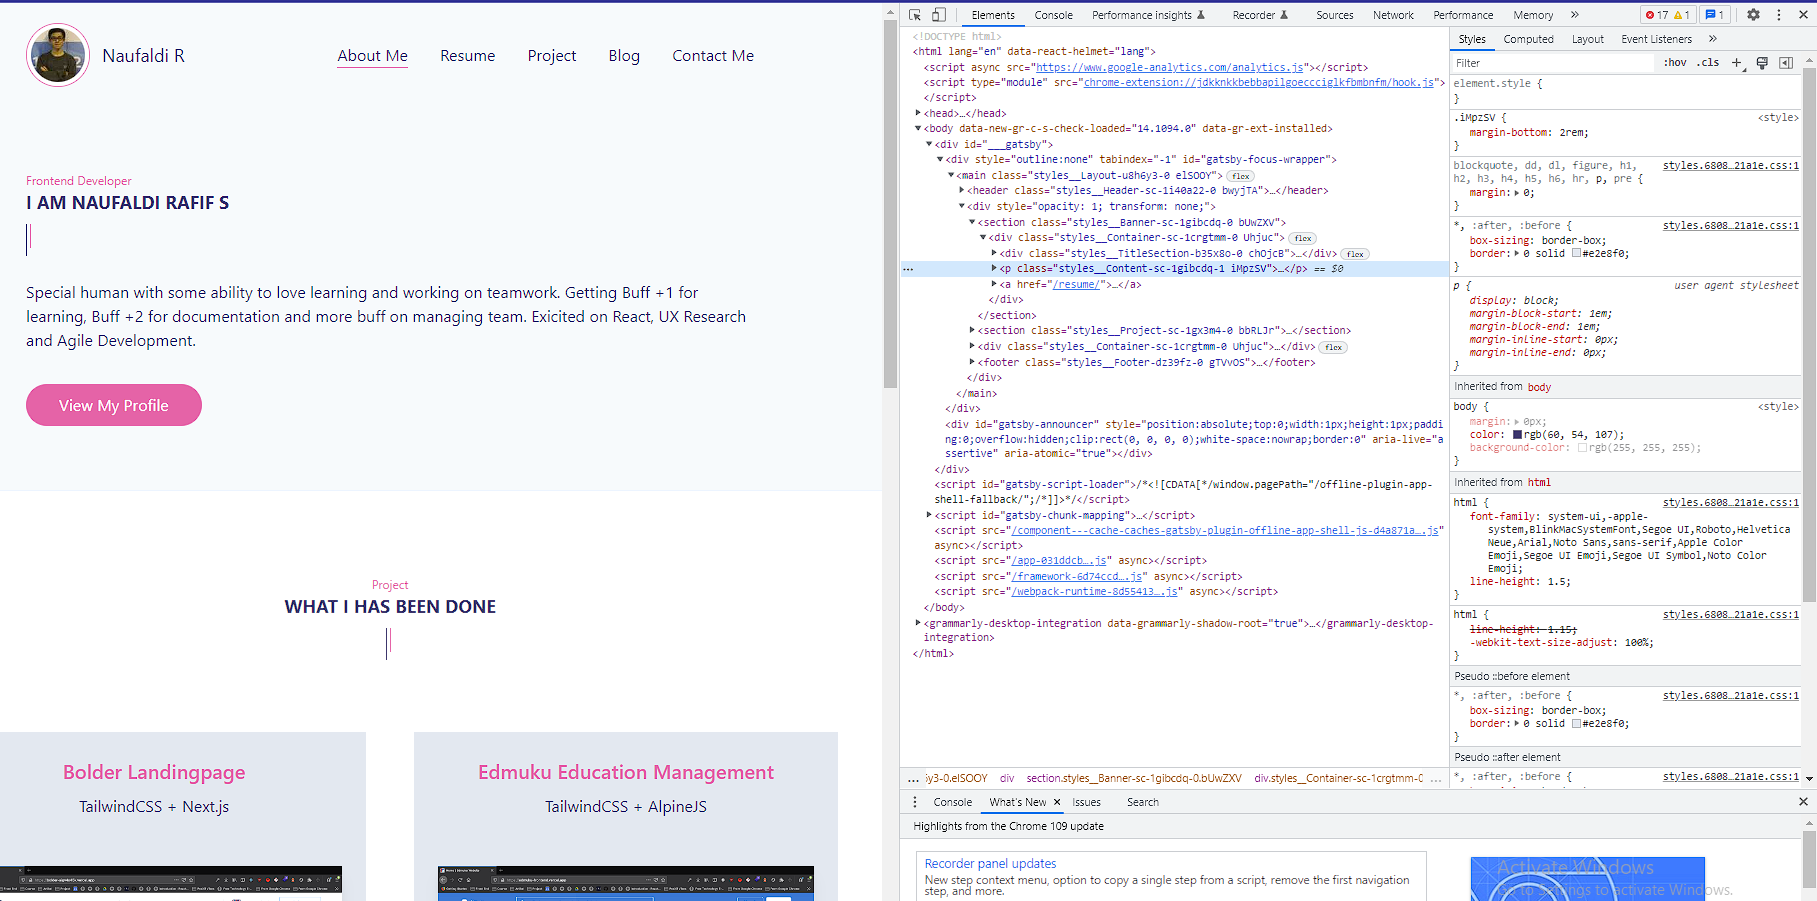
These are basic things that every front-end developer should know. Everything on the front-end will be displayed here. These tools allow you to inspect HTML, CSS, and Javascript on a page, often providing clues as to what is causing a problem.
For example, when debugging HTML/CSS, you can check the style section and computed section to see what is causing an issue.
- Style applied
- Causing HTML to have "strange" behaviour
- Size of HTML
- etc
Console
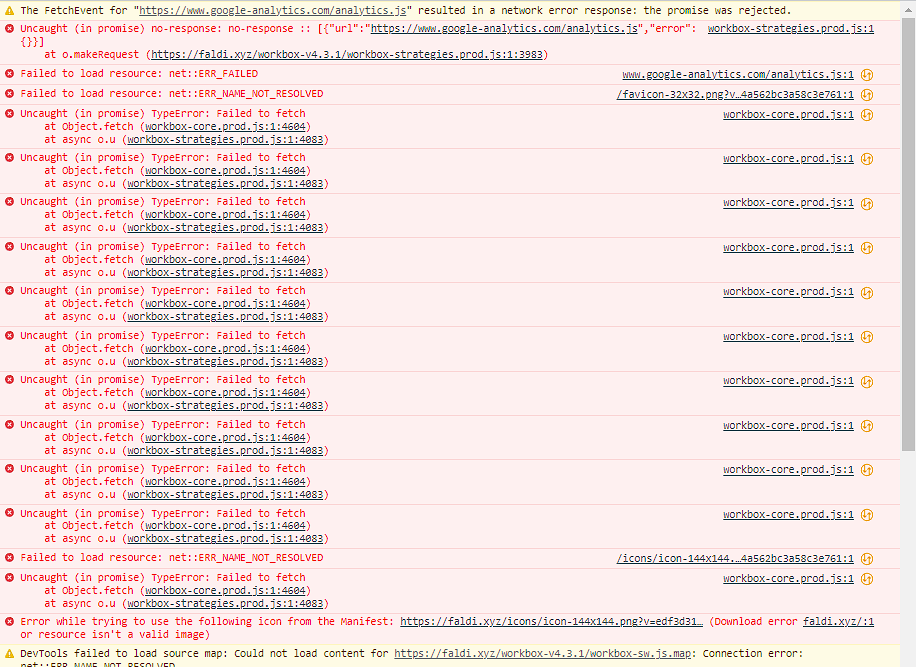
Use the console browser to check for errors. Every error related to JavaScript will be displayed here, providing enough information to help determine where the problem is occurring in our code.
Keep in mine, we must to know how to read error. Take a example,
TypeError: Failed to fetch
It appears that some of our code has failed to fetch data, which may be related to the Workbox library used for Progressive Web Applications (PWA). If we encounter errors in our PWA settings, we can assume that this is the cause. Additionally, if we use Safari, we may encounter some "strange" or "unique" errors.
Another things is, if we use Safari than we will encounter some "strange" or "uniq" error like i got yesterday.
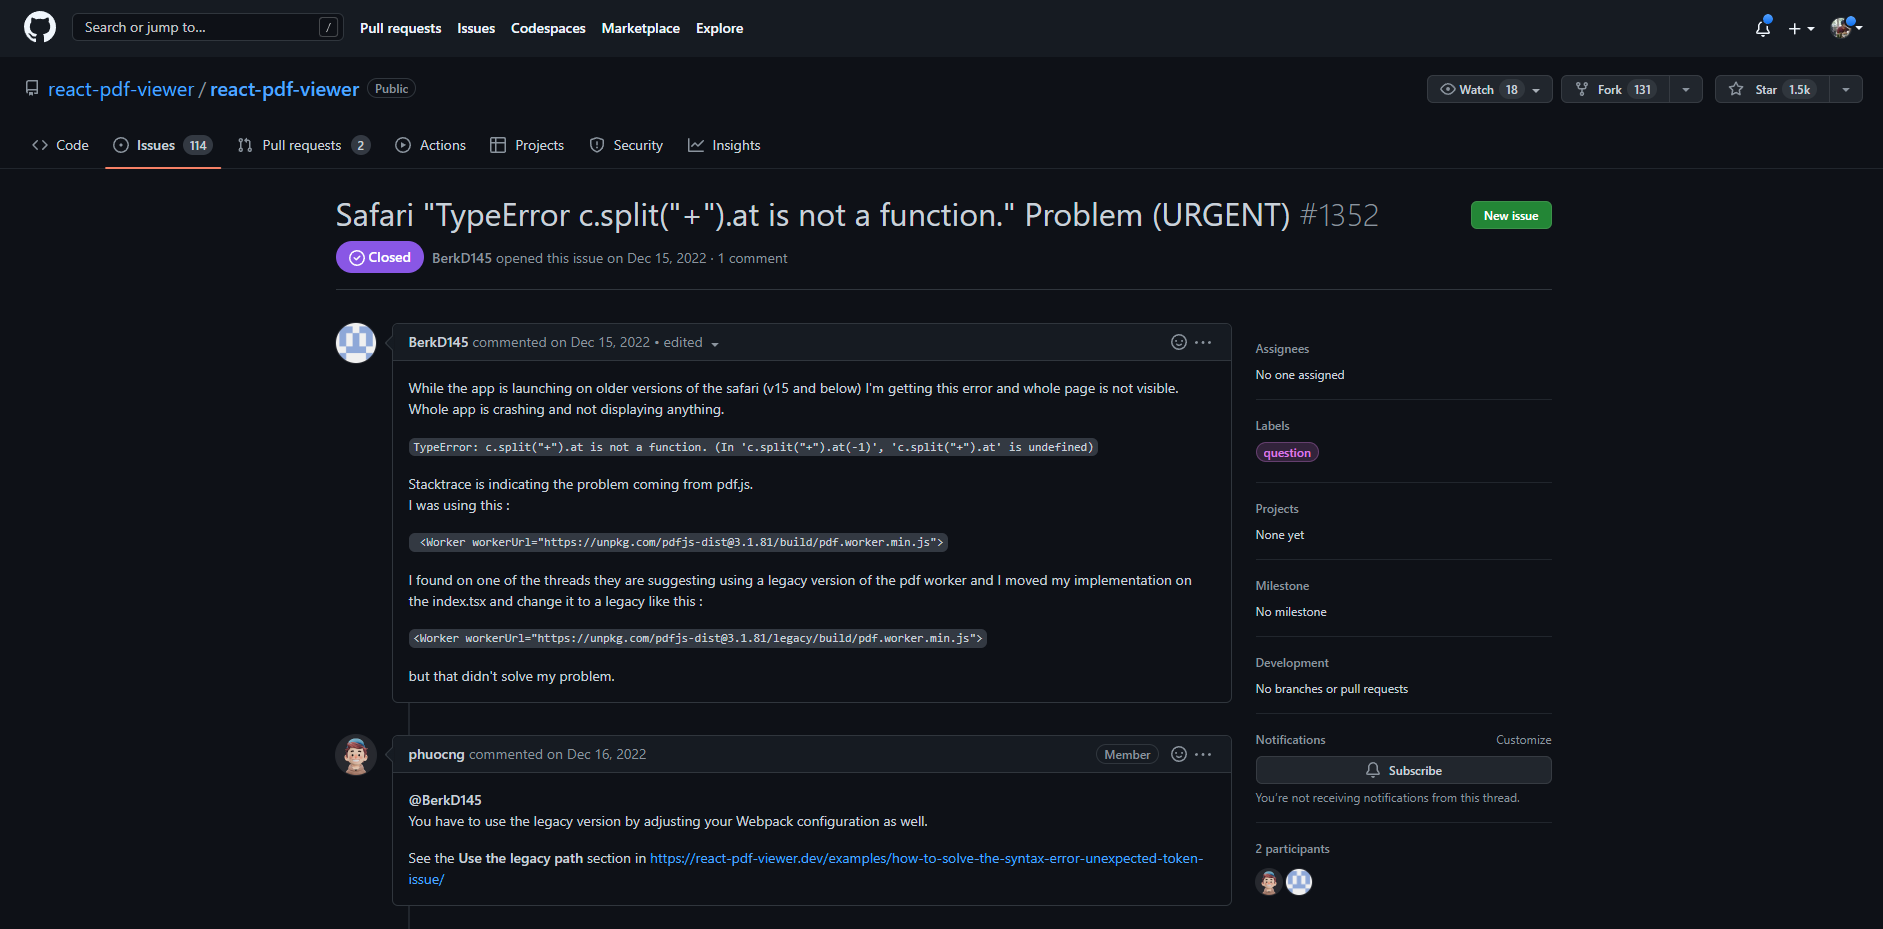
Console in browser just giving not enough information and print TypeError: c.split("+").at is not a function. (In 'c.split("+").at(-1)', 'c.split("+").at' is undefined)
We may not know the cause of this error or why it is happening, but it could be due to modern JavaScript not being supported in Safari.
Network
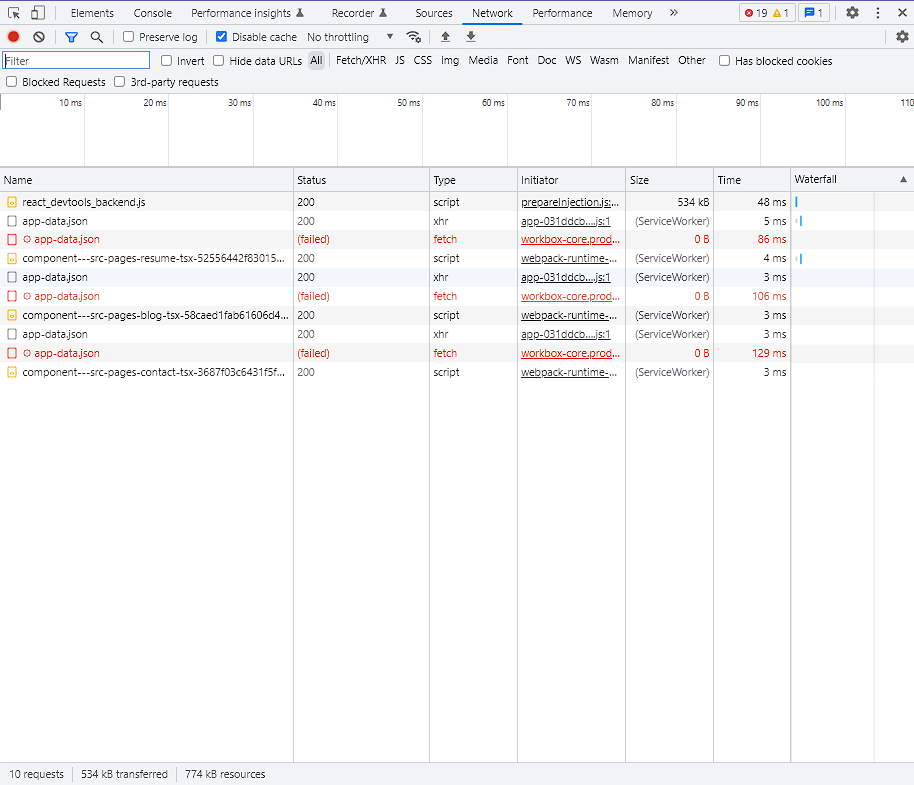
Network tab in chrome allow you to view and debug network requests and responses for a website. We can easily identify and troubleshoot issues with
- API / Data Request
- JS, CSS / other media / file
- Inspect Network Header Request, Cookies and Payload from request
To easily disable caching and test different network speeds, we can use Chrome Dev Tools and the Throttling feature. This is important as caching can make debugging more difficult if changes have been made to our web application.
React Developer Tools
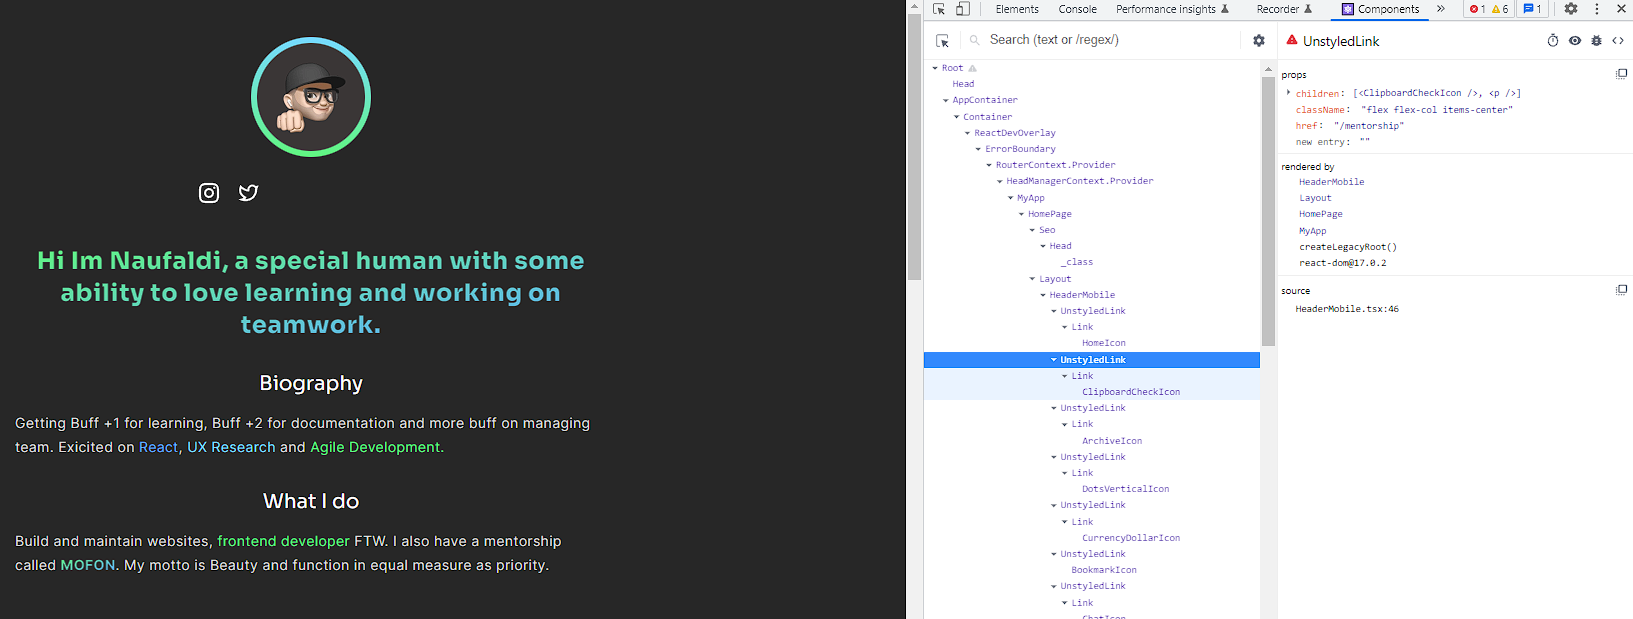
React Developer Tools is a browser extension that allows developers to inspect and debug React components in a website or application. It allows developers to easily view the component hierarchy and props, as well as the state and context of a React application.
This can be extremely helpful for identifying and troubleshooting issues with the structure, layout, and functionality of a React application. Additionally, React Developer Tools allows developers to interact with the components in real-time, by changing the props and state, and seeing the effect on the application.
Lighthouse
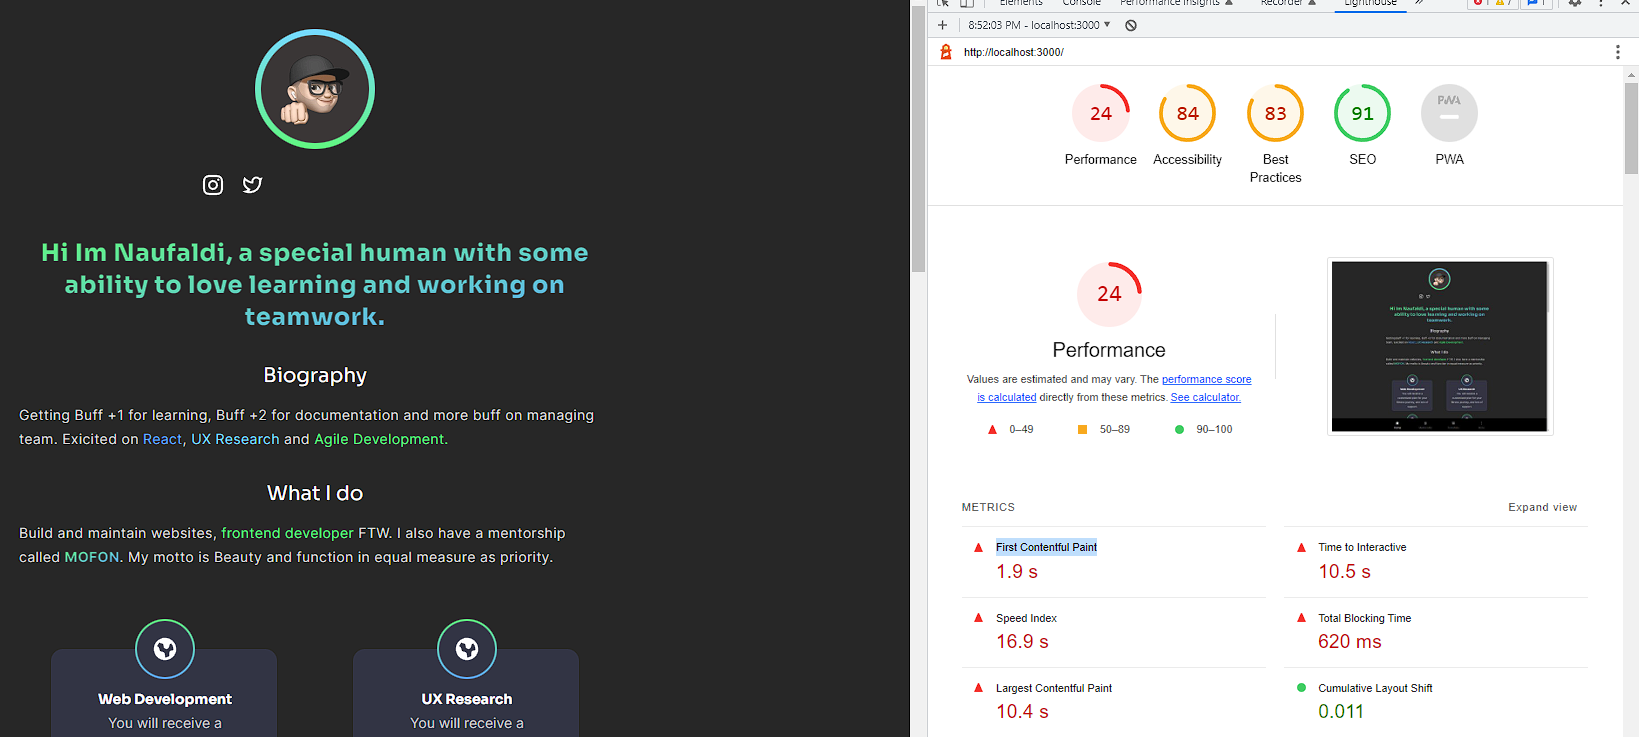
Lighthouse is a tool that can be used to analyze the performance, accessibility, best practices, and SEO of a website.
Using Lighthouse will generate report to giving us insight about our website, and we can take action. Example regarding First Contentful Paint, Loading Time and other things. Not only generate report, lighthouse giving advice cause of the problem and how we solve problem.
Sentry
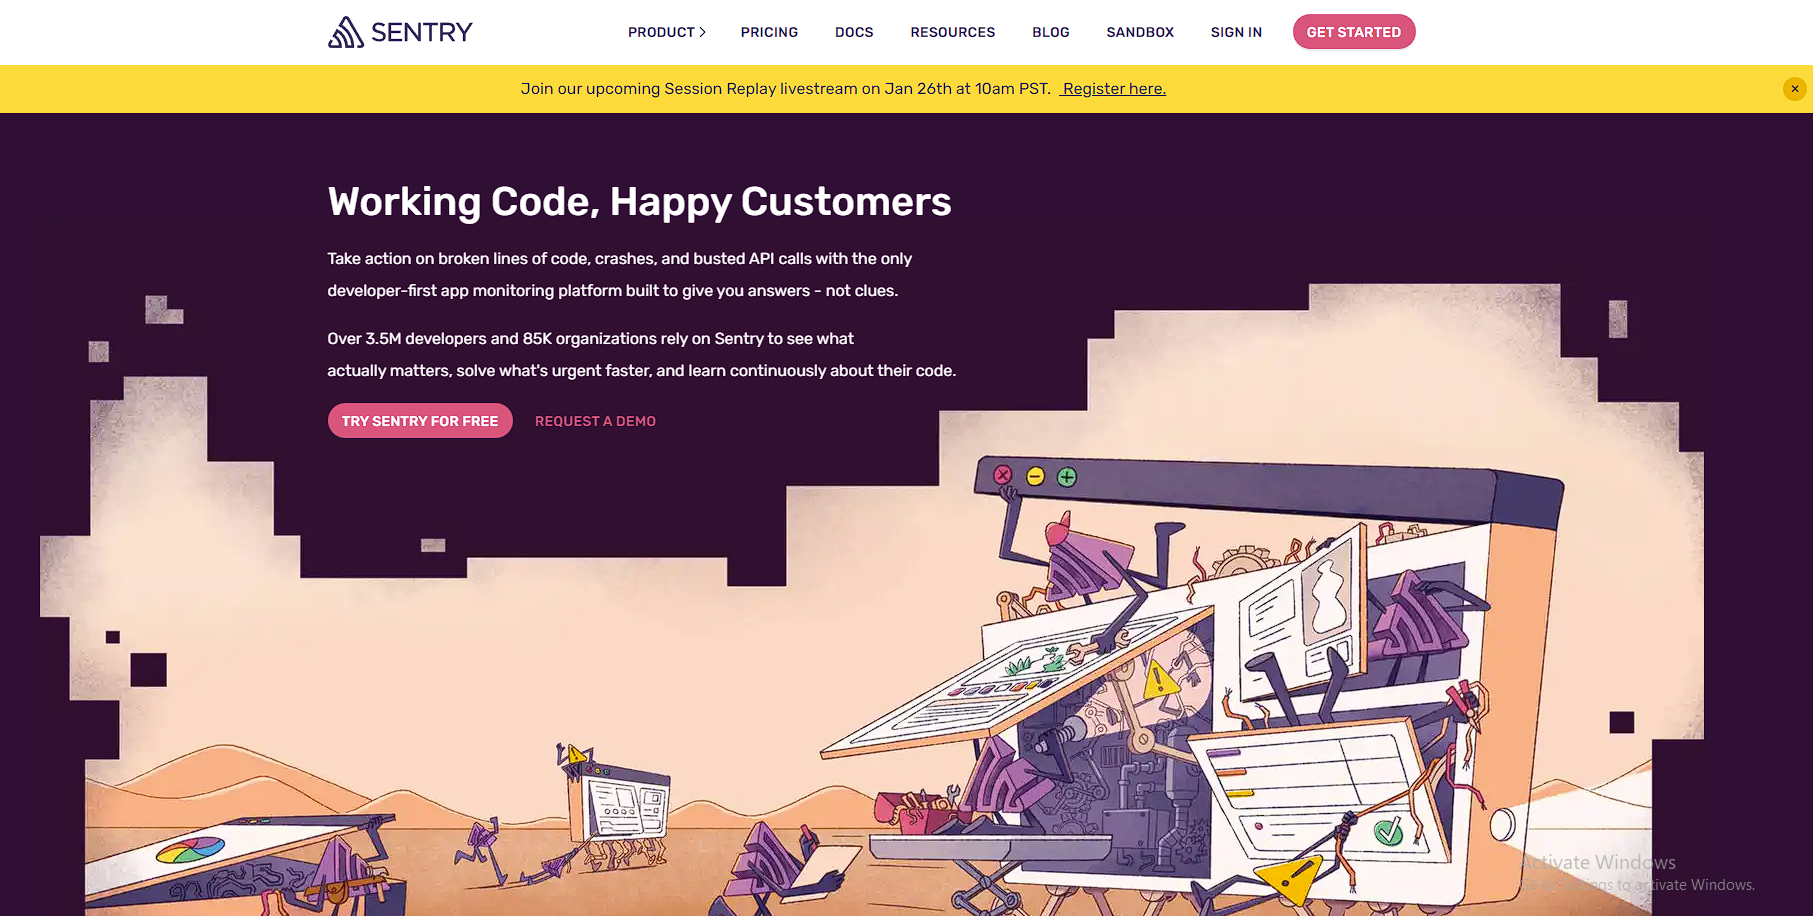
Sentry is an error tracking and monitoring tool that allows developers to identify and troubleshoot issues in their applications. Sentry is an tools for production to help identify and fix issues that may not be immediately visible in development.
Sentry can be used for web, mobile and server-side applications, and supports multiple programming languages, including JavaScript, Python, Ruby, and Java. Sentry is widely used by developers to improve the development and debugging experience, and to ensure a better user experience by catching and fixing issues as soon as possible.
Debugging code as a front-end developer can be quite challenging in today's environment, especially with the many new features and tools available. However, new updates and features are continually being released to improve debugging. Some examples that are not mentioned in this article include the Debugger in Chrome and Elastic APM. It is hoped that this article will help to improve the debugging skills of front-end developers.